The IMPC has developed a new, innovative way to display data so that you can compare knockout mouse lines for different genes that share the same trait, or all phenotypes for one gene.
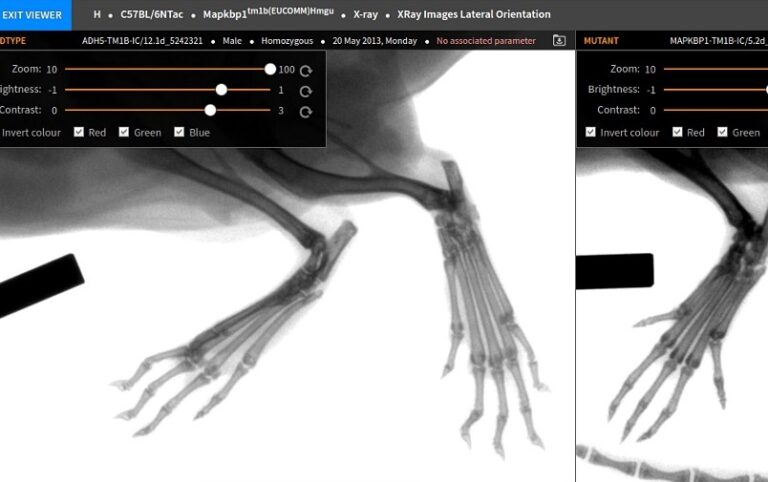
Phenoview: a new tool to compare IMPC data The IMPC has developed a new, innovative way to display data so that you can compare knockout mouse lines for different genes that share the same trait, or all phenotypes for one gene. ‘Data is only as good as the tools available to analyze it.’ So starts the latest paper from the International Mouse Phenotyping Consortium, which is aiming to create a catalogue of mouse traits that shed light on the functions of 20,000 mammalian genes. Published in Nature Methods, Gagarine Yaikhom and the other authors from MRC Harwell’s Biocomputing team describe their latest tool, designed to maximise the potential of IMPC data – Phenoview. Phenoview has been specially developed for the IMPC, and is therefore carefully tailored to make sifting through, viewing and comparing large swathes of genotype-phenotype data as effortless as possible. It is publically available and can be accessed via the sidebar of the IMPC website. The first thing you see as you enter Phenoview is a heatmap. This huge grid gives an overview of all IMPC results, with phenotyping tests listed down the side and the genes laid out along the top. There are many additional features; for example, you can choose to only see results from certain centres, adjust the statistical stringency using a slider scale, or just show significant results. There are two ways of finding data – either browse for genes of interest by selecting the genes, procedures and parameters you are interested in from the relevant lists, or use the search box to go straight to the results for a specific gene. By selecting the genes and parameters you are interested in, you can then add them to the basket, just like with online grocery shopping. Once you have all the data you need, you can then click ‘visualise’ to compare all of the results side-by-side. In most cases this is represented graphically, but for some, such as X-ray results, it is displayed as images – the appropriate method for each test is chosen automatically. This mix-and-match approach means you can easily investigate the data you care about, see for yourself how strong a phenotype is in that line, compare the data for multiple lines and choose the appropriate knockout mouse lines for your research. It enables you to filter out the relevant IMPC data, whether it be genes for a particular phenotype, or phenotypes for a particular gene. And if you want to delve even deeper into the data, it is also possible to download the raw results. The beauty of Phenoview lies in its apparent simplicity, yet it covers a massive amount of data and still allows in-depth investigation. As the IMPC accumulates ever more data, this tool will allow researchers to find the connections between genes and phenotype they require with ease.